In this tutorial we'll show you how to use your microcontroller to send data to Microsoft Power BI. This will enable you to do things like store and graph temperature readings (or anything else) over time.
This tutorial uses our Microsoft > Power BI > CreateDataset Choreo as well as our Microsoft > Power BI > AddRow Choreo.
We're using an Arduino Yún for this tutorial. If you're not using a Yún, we have the same tutorial for the following embedded devices:
1Make sure you have a Temboo account. If you don't already have one, you can register for free.
2Make sure that you have the latest version of the Arduino IDE. You should also be sure that you have the newest version of the Temboo Library by checking the Arduino Library Manager.
3Make sure that your Yún is connected to the Internet. Arduino has a helpful guide if you need assistance.
4Since this sketch uses Microsoft Power BI, you'll need a Power BI account and a Power BI application within which you'll generate and store your sensor data. Follow these instructions to get set up with Power BI.
5Once you've created your Power BI account and set up a Power BI app, make sure that you save your ClientID and ClientSecret - you'll need them to run through the OAuth process in the next step.
6Now, run through the Microsoft OAuth process using the details of your Power BI app. You can get started with the InitializeOAuth Choreo, but before you do we recommend watching this 2-minute screencast. It'll help make the OAuth process clear and save you time getting set up.
When you're filling in the inputs for the InitializeOAuth Choreo, make sure to specify the following value in the Resource input, which tells Microsoft that you want to access Power BI programmatically. You can also use this value when you're asked for a Resource value in the FinalizeOAuth Choreo.
https://analysis.windows.net/powerbi/api
7After setting up your Power BI app and running through the OAuth flow, you're ready to create your dataset via the Microsoft > Power BI > CreateDataset Choreo.
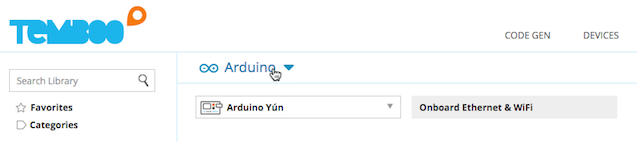
8Select Arduino from the drop down menu at the top of the Choreo page, then specify whether you're working with the Yún or another Arduino board paired with the Yún Shield.
9Enter the appropriate values into the required input fields based on the Power BI application that you set up previously. For the dataset specification, you can use the following JSON which gives a simple sensor readings table with two columns - temperature and humidity:
{
    "name": "SensorData",
    "tables": [
        {
            "name": "SensorReadings",
            "columns": [
                {
                    "name": "Temperature",
                    "dataType": "Int64"
                },
                {
                    "name": "Humidity",
                    "dataType": "Int64"
                }
            ]
        }
    ]
}
Here's a screenshot of what the populated Choreo form should look like:
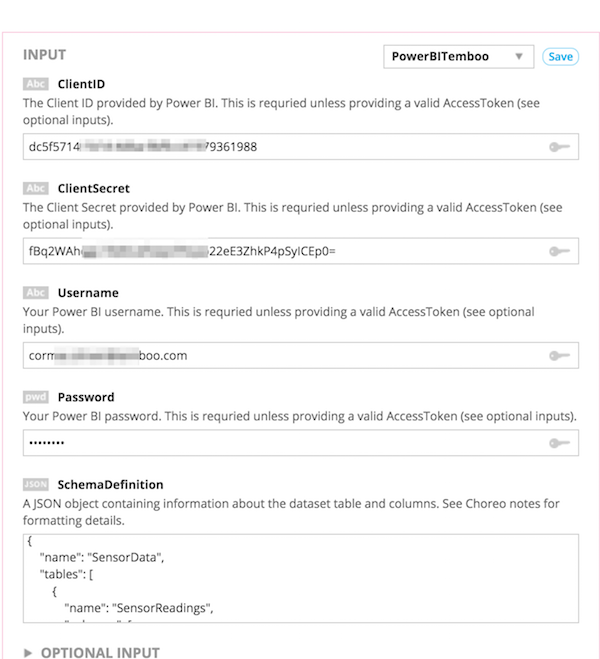
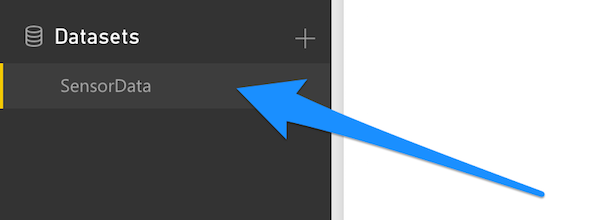
10Now click Generate Code to run the Choreo. This will create your dataset on Power BI and give us a place that we can start adding sensor values to. You'll be able to see your new dataset on your Power BI dashboard.
Make sure to note response returned by Power BI in the Choreo's Response output. You'll need to supply the dataset ID as an input to the AddRow Choreo in the next section. Your response data will look something like this - it contains both the dataset ID and its name:
{
  "@odata.context":"http://wabi-us-north-central-redirect.analysis.windows.net/v1.0/myorg/$metadata#datasets/$entity","id":"[your_dataset_id_here]","name":"SensorData","defaultRetentionPolicy":"None"
}
11With the dataset in place, we can generate code that will send sensor data readings into the Power BI dataset, which we can then turn into a graph.
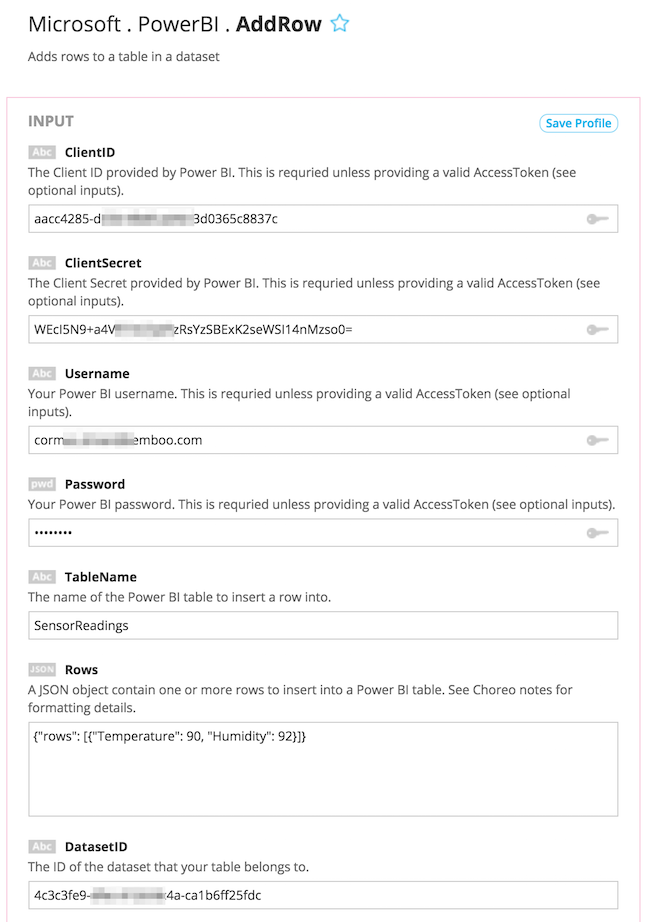
12Go to the Microsoft > Power BI > AddRow Choreo in our Library.
13Fill in the required inputs, using the dataset ID returned by Power BI when you ran the CreateDataset Choreo. Remember that we called our table SensorReadings, so make sure to use that name for the TableName input. For the Rows input, you can use the following JSON, which maps to the dataset schema that we set up earlier.
{"rows": [{"Temperature": 90, "Humidity": 92}]}
14Click Generate Code to test the Choreo from our site. This will add a row of data to your dataset in Power BI. Head over to your Power BI dashboard and make sure that your data is appearing as expected.
15At this point, Temboo has auto-generated the code that you need to send sensor values to Power BI, so the next step is to grab the code and try it out.
16Scroll down and copy the Arduino code from the Code section and paste it into your Arduino IDE.
17The auto-generated sketch references the TembooAccount.h header file, which contains your Temboo account information. You'll find the code for this file beneath your generated sketch. Create a new tab in the Arduino IDE called TembooAccount.h and copy in the header file information.
You'll notice that your sketch always sends the same value to Power BI. Of course, it's far more interesting to send dynamic values i.e., sensor values. Here's an example of what you need to do to make that happen.
18Add the following lines of code to your setup() method so that you're reading the value on pins A0 and A1:
pinMode(A0, INPUT);
pinMode(A1, INPUT);
19Next, replace the line of code that currently adds data to Power BI with the following code so that your sketch reads the values on pins A0 and A1 and adds it Power BI instead.
String temperature = (String)analogRead(A0);
String humidity = (String)analogRead(A1);
String sensorJSON = "{\"rows\": [{\"Temperature\":" + temperature + ", \"Humidity\":" + humidity + "}]}";
AddRowChoreo.addInput("RowData", sensorJSON);
20That's it! Now your sketch should be generating dynamic values and adding them to your Power BI dataset.
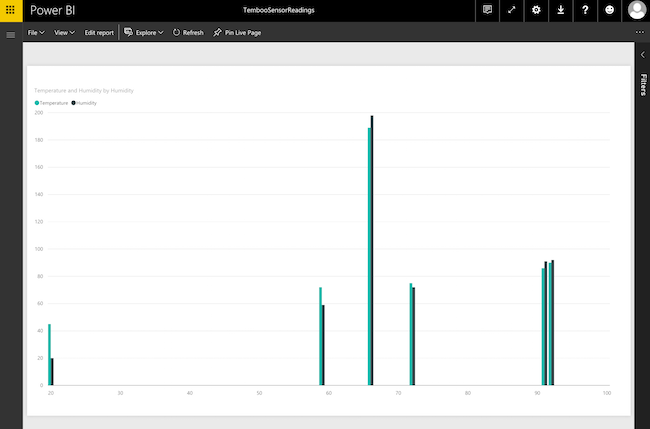
21Finally, log into your Power BI dashboard and turn your dataset into whatever type of graph works for you. Here's one that we created from our sensor data from this example.
Now that you've mastered working with Power BI, why not check out the rest of the 2000+ Choreos in our Library and get inspired for your next project.
Once you've got your code up and running, you're ready to move on and do more. From monitoring your running applications, to moving your generated Temboo code to your preferred development environment and sharing it with colleagues, collaborators and friends - we've got you covered.
We're always happy to help. Just email us at support@temboo.com, and we'll answer your questions.