Create Sensor Data Graphs with Temboo


Monitor sensors with Cloud Controls

In this tutorial we'll show you how to use Temboo's Data Visualization tools to graph data in your browser from any sensor that outputs 0-5 V. Here's what we'll cover:

  • Setting up your sensor
  • Auto-generating sensor monitoring code
  • Accessing your sensor data graph
  • Triggering email alerts with your sensor

Monitoring Sensor Data

Before You Start

1You’ll need your Yún to be connected to the internet. If you need help with that, take a look at Arduino's excellent documentation.

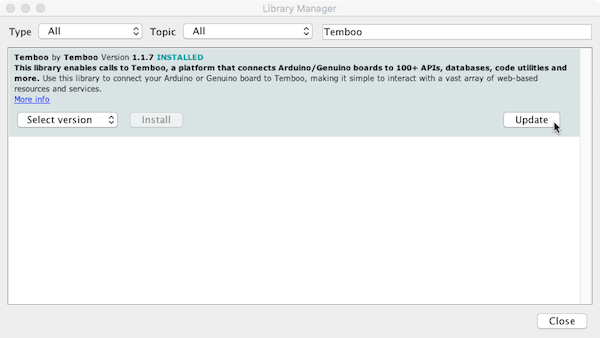
2 Since this tutorial uses the Arduino Yún, you’ll need to download and install the latest version of the Arduino IDE. Once you have it installed, get the latest version of the Temboo library for Arduino by going to the Sketch > Include Library > Manage Libraries... menu in the Arduino IDE, finding the Temboo library, and upgrading to the latest version as necessary.

Updating your Temboo Library in the Arduino IDE

3Finally, you will run a configuration sketch to prepare your Yún for sending sensor data to Temboo. If you're using a Yún, go to the File > Examples > Temboo > ArduinoYun menu and run the CloudControlsConfig sketch. If you're using a Yún shield, go to the File > Examples > Temboo > YunShield menu and run the CloudControlsConfig sketch. Now you're ready to start generating code!

Set Up Your Sensor

1Log in to Temboo. If you don't already have an account, you can sign up for free.

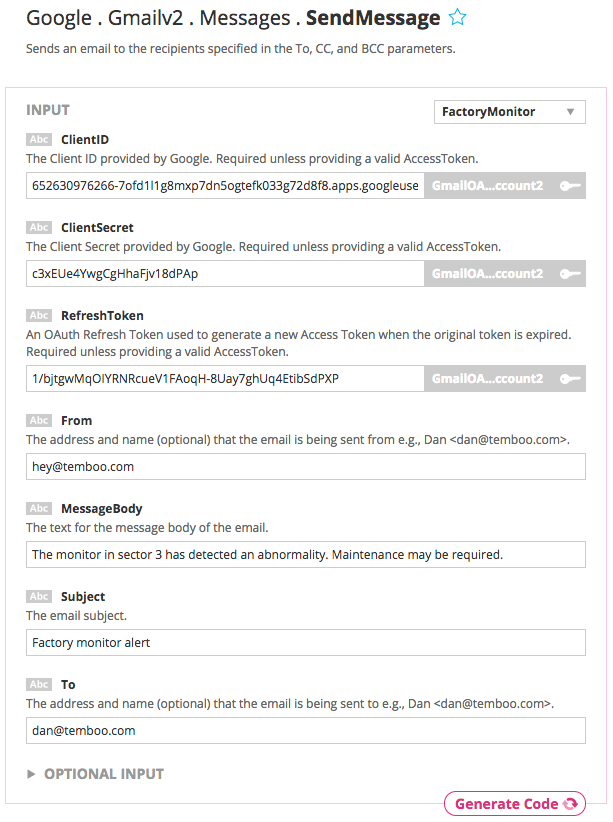
2Once you're logged in, go to our code generation tool and find the Gmailv2 > Messages > SendMessage Choreo. A Choreo is a cloud-based process that connects your Yún to any web-based service, and every Temboo application is associated with at least one Choreo.

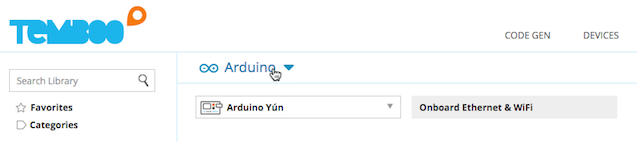
3Use the dropdown menu at the top of the Choreo page to select the Arduino Yún or another Arduino paired with the Yún Shield as your device.

Selecting the Arduino Yún on the Choreo page.

4The first step in monitoring sensor data is to set up the sensor you wish to monitor. We provide unit converted data for specific sensor models, such as Celsius and Fahrenheit for temperature sensors. We also support unconverted data which is reported as raw values for analog data and high/low for digital.

For this tutorial we're going to read data from a generic sensor that outputs 0-5 V.

Using the virtual pin board on the Choreo page, select pin A0 to set up your sensor. Select the category Other, then choose Other.

Setting up a pin on the virtual pin board

5Each time you set up a sensor you'll be asked to specify the safe bounds and the caution bounds. These bounds are used to determine the color coding of the data that appears on your graph. Safe data is colored green and data near the bounds is orange. Data outside the bounds is red.

Temboo will return the sensor readings as raw values between 0-1023. Set the safe bounds as between 552 and 818, and the caution bounds as plus or minus 82. That's all we need to do to set up our sensor, so press Save.

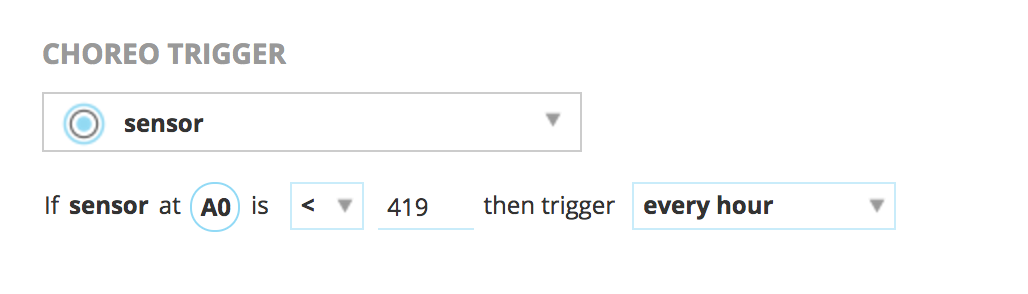
6We will focus on getting sensor data graphs running first. In part 2 of this tutorial, we will set up the email alert. So for now, set a condition based on that sensor in order to run the SendMessage Choreo as infrequently as possible. Use the conditions interface to set a condition that will usually be false, and set the frequency to once a day.

Setting a condition

Generate your code

7Next, we'll generate the code that will send our sensor data to Temboo. Scroll down and find the code box. Click the triangle next to Simple Code to open the code menu, and choose Enhanced Code.

Selecting enhanced code

8Now you will register your device. To do so, name your device and, optionally, give it a description. Specify the device location—this will allow you to view your devices on a map. For testing purposes, it's good to set a relatively short sensor interval so that you can see sensor data populate your graphs quickly. You can use the custom interval option for this. Press Save when you're done.

Device registration on Temboo

Run your code

9Once you've registered your device, you'll find the auto-generated Data Visualization code in the Code section. Copy and paste your generated code into the Arduino IDE.

10 Just below the Code section, you'll find the Header File section. The code in this section contains your Temboo account information and must be included alongside your sketch. To do so, make a new tab in the Arduino IDE, call it TembooAccount.h, and copy this code into it.

11 That's all the code you need. Upload it to your Arduino Yún from the IDE.

View your sensor data graph

12Now that your sketch is running on your Yún, keep this Choreo page open, and save it for later to use with part two of this tutorial. Open a new browser window to head over to your Devices page to see it in action. A virtual representation of your device will be waiting for you.

Temboo Devices Dashboard

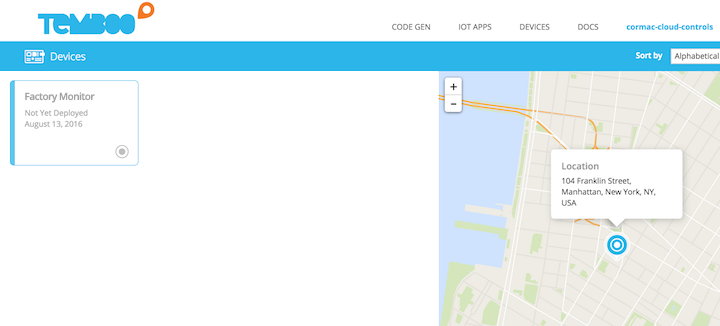
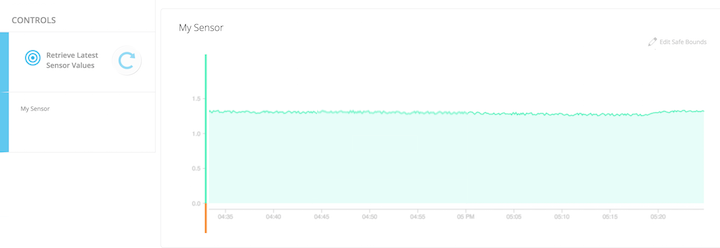
13Select your new device and you'll see a sensor data graph for the sensor that you set up. Over time, you'll be able to see sensor data graphs for various time periods. Additionally, at any time, you can request the latest value of your sensors. This is a handy feature for when you're between sensor intervals but want to know what's happening on your device.

Single device view

That's it! You now know how to monitor sensor data with Temboo. Follow along with part two of this tutorial to add email alerts triggered by sensor values to your new application.

Need help?

We're always happy to help. Just email us at support@temboo.com, and we'll answer your questions.

Triggering Emails with your Sensor

Triggering the Email Alert

The application we just built in part one of this tutorial successfully graphs sensor data on Temboo. Now let's make it do a little more. We're going to set up the code to use the sensor to trigger the Yún to send an email via Gmail. As we discussed in part one, a Choreo is a cloud-based process that connects your Yún to any web-based service, and we'll be looking specifically at the Gmailv2 > Messages > SendMessage Choreo. However, the process for setting a Choreo Trigger condition is the same for any Choreo.

Get set up with Gmail

Gmail uses OAuth authentication. This short video demonstrates how to use our OAuth Choreos, and it's a good idea to take a break and watch it now before you dive into this step.

1You'll need a Google account. If you don't already have one, you can sign up here.

2Login to Google's Developer Console, and create a new Project if you haven't done so already.

3Using the API Manager, enable API Access for the Gmail API in the Overview tab.

4Under the Credentials tab, create a new Client ID and specify Web application for the Application Type. When configuring the Consent Screen, you must fill out the Email Address and Product Name fields. Save the Consent screen details.

5Specify this callback URL as the Authorized Redirect URI:

https://ACCOUNT_NAME.temboolive.com/callback/google

6 Go to the Google > OAuth > InitializeOAuth Choreo page and specify the Client ID from the app you registered at Google and at least one of the following Scopes:

https://www.googleapis.com/auth/gmail.modify
https://www.googleapis.com/auth/gmail.readonly
https://www.googleapis.com/auth/gmail.compose
https://mail.google.com/

7Run the Choreo by clicking the Generate Code button. The InitializeOAuth choreo will return an authorization URL and a callback ID (required for the FinalizeOAuth step).

8Open a new web browser window, navigate to the authorization URL returned by the InitializeOAuth Choreo, and click Accept to grant the app access to your Google account.

Google OAuth Accept

9Run the Google > OAuth > FinalizeOAuth Choreo, specifying the callback ID returned earlier by the InitializeOAuth Choreo. This process will return a Refresh Token which can be used along with the Client ID and Client Secret to authenticate with Google. You'll need these for the next step.

Fill in the Choreo Inputs

10Go back to the browser window you saved earlier where we set up our device using the Gmail2 > Messages > SendMessage Choreo. Supply the ClientID, ClientSecret, and RefreshToken you just obtained from the OAuth process.

11Fill in the From address with the email address of the Google account you authenticated in your OAuth steps above. Supply the email Subject and MessageBody. In To, enter the address of the email's recipient.

Supplying inputs to the Gmail Choreo

12Test your Choreo inputs by clicking Generate Code. You should see a success message on the page, and if you emailed yourself, you'll find a new message in your inbox.

Setting Up the Choreo Trigger

When we set up the sensor in the first part of this tutorial, we were given the ability to specify a condition based on our sensor value that would trigger our Choreo to run. We then set it to prevent our Choreo from running, but now let's set it so an email alert is sent whenever our sensor reading is too low.

13We want the Yún to send an email if the sensor value is lower than 419, so click the operator dropdown menu and choose the less than sign, and change the number to 419. We can also set how many times we want our email to send in the event that the condition is met—this helps prevent sending too many alert messages.

Setting a condition to trigger an email alert

Run your code

14Now the generated code has been automatically refreshed with the new settings. Copy and paste to replace your previous sketch in your IDE with the new code from the code box. Your TembooAccount.h header file will remain the same, so there's no need to update it. Now upload the new code to your board as before.

View your sensor data graph & receive alerts

15With your new Data Visualization sketch on your Yún, you'll still find your device graphs on the Devices page. Now, whenever your analog pin reads a raw sensor value of less than 419, your Yún will send an email alert.

What's next?

Congratulations! You've just created a robust application complete with sensor data monitoring and email alerts, all without writing any code. Now that you know how to connect your Yún to the cloud with Temboo, you're just a few steps away from making something extraordinary. With Temboo handling all the small stuff, you're free to think big.

The principles introduced in this tutorial are applicable to any Choreo in our library and any combination of sensors. Why not explore our Choreo Library and start planning your next project? Or, try one of these tutorials:

Need help?

We're always happy to help. Just email us at support@temboo.com, and we'll answer your questions.

Sensors: Frequently Asked Questions

What types of sensors do you support?

We provide dedicated support for sensors in the following categories:

  • Motion
  • Temperature
  • Liquid Level
  • Distance
  • Light
  • Gas
  • Pressure
By dedicated support we mean that within each category, we support specific sensor models from manufacturers like Panasonic, Analog Device, Texas Instruments, Sharp and others. For these sensors, we automatically convert sensed values into the real world units of your choice to make your sensor data graphs as intuitive as possible. We currently support the following sensors:

  • Panasonic EKMC160112 motion sensor [datasheet]
  • Texas Instruments LMT84LP temperature sensor [datasheet]
  • Analog Devices TMP36GT9Z temperature sensor [datasheet]
  • Honeywell LRNH31S41 liquid level switch [datasheet]
  • Sharp GP2Y0A21YK0F distance sensor [datasheet]
  • TE Connectivity Measurement Specialties M3051-000005-100PG Pressure sensor [datasheet]
  • Advanced Photonix PDV-P8103 light sensor [datasheet]
  • Hanwei Electronics MQ-5 Gas Sensor (Carbon Monoxide) [datasheet]

Outside of dedicated sensor support, we also enable the use of both 4-20mA sensors and any other digital or analog sensor that you can attach to a microcontroller. For 4-20mA sensors, we support custom conversions by requiring the following information:

  • The human-readable units that your 4-20mA sensor can produce e.g., celsius / fahrenheit for a temperature sensor
  • The lower and upper bounds of those units as specified by the sensor manufacturer

You can find more detail on how we handle sensor conversions below.

How do you handle sensor data conversions?

We handle sensor data conversions in three specific ways:

  • Auto-converted data for specific sensors
  • Auto-converted data for 4-20mA sensors
  • Unconverted data, represented as voltage for analog sensors or high / low for digital sensors

For specific sensors, we handle the conversions automatically based on the real world units you choose when setting up your sensor e.g., C or F for a temperature sensor. Sensor conversions are performed in the cloud, reducing both the amount of code on your device and the amount of work your device has to do, which in turn saves power. We perform sensor conversions based on the data sheet provided by the sensor manufacturer. Where a given sensor has a range of expected values, we have based our calculations on the average expected value provided by the manufacturer.

For 4-20mA sensors, when setting up your sensor in our code generation tool, we ask for the lower and upper bounds of your sensor as specified by its manufacturer, as well as the units, and we convert from mA to those units e.g., from mA to temperature in celsius. Please note that we assume all 4-20mA sensors are set up to use a 250 ohm resistor.

For any other analog sensor, we convert raw analog values to voltage and graph that for you. For any digital sensor that we don't know about, we graph high / low.

Some sensors require the use of a resistor when you are wiring them up to your microcontroller. Unless otherwise stated by the sensor manufacturer, we assume the use of a 10K ohm resistor. For power, we assume you are using the 5V pin as input to the sensor unless otherwise stated by the manufacturer.

What are safe bounds and caution bounds?

Safe bounds and caution bounds are values that you supply in order to produce a graph that makes sense for your particular application. Safe bounds e.g., 50-70 degrees fahrenheit, will appear as green on your graph. The caution bounds are specified as a single value e.g., +/- 2 degrees fahrenheit , and your graph will show orange for sensor values 48 - 52 fahrenheit and 68 - 72 fahrenheit. Outside of the safe and caution bounds, the graph will show sensor values in red.

Once you have a graph up and running with safe and caution bounds, you can edit them at any time directly from the graph.

How do you render graphs with millions of data points?

In order to efficiently render graphs based on potentially massive sensor datasets, we use a popular data visualization technique called downsampling. Downsampling is the process of selecting and rendering representative data points from the dataset, producing a lower resolution view of the dataset that preserves the character of the data, meaning that you get the benefit of seeing how your sensor has been behaving over long periods of time, without having to wait a long time to see it.

What happens when my device goes offline?

If you enable the "Safeguard data" option when registering your device, we'll store up to 70,000 sensor readings on your device (consuming ~2MB of memory) in the case that your device loses connectivity. Your device will send that data to Temboo once it regains connectivity, and the data will then appear in your graphs. At a rate of one sensor reading per minute this gives you 49 days of downtime without data loss for a device with a single sensor.

I have a sensor that you don't support - what can I do?

Please get in touch! Let us know what you're working on and which sensors you're using. We'd love to learn about what you're building and discuss how Temboo can be a part of it.


Back