Before You Start
1You’ll need your Yún to be connected to the internet. If you need help with that, take a look at Arduino's excellent documentation.
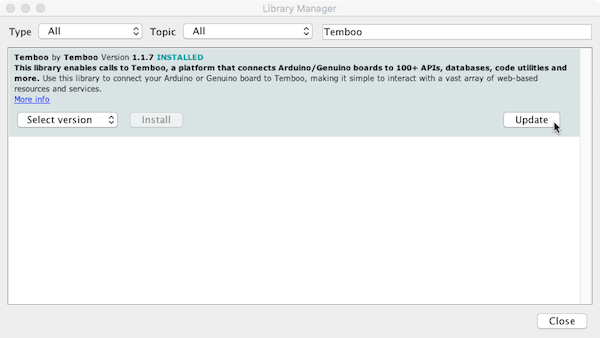
2 Since this tutorial uses the Arduino Yún, you’ll need to download and install the latest version of the Arduino IDE. Once you have it installed, get the latest version of the Temboo library for Arduino by going to the Sketch > Include Library > Manage Libraries... menu in the Arduino IDE, finding the Temboo library, and upgrading to the latest version as necessary.
3Finally, you will run a configuration sketch to prepare your Yún for sending sensor data to Temboo. If you're using a Yún, go to the File > Examples > Temboo > ArduinoYun menu and run the CloudControlsConfig sketch. If you're using a Yún shield, go to the File > Examples > Temboo > YunShield menu and run the CloudControlsConfig sketch. Now you're ready to start generating code!
Set Up Your Sensor
1Log in to Temboo. If you don't already have an account, you can sign up for free.
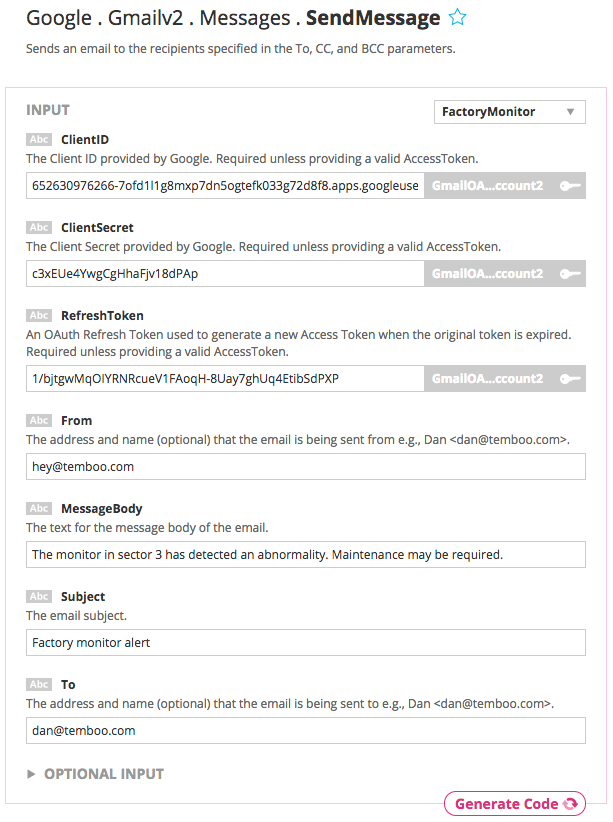
2Once you're logged in, go to our code generation tool and find the Gmailv2 > Messages > SendMessage Choreo. A Choreo is a cloud-based process that connects your Yún to any web-based service, and every Temboo application is associated with at least one Choreo.
3Use the dropdown menu at the top of the Choreo page to select the Arduino Yún or another Arduino paired with the Yún Shield as your device.

4The first step in monitoring sensor data is to set up the sensor you wish to monitor. We provide unit converted data for specific sensor models, such as Celsius and Fahrenheit for temperature sensors. We also support unconverted data which is reported as raw values for analog data and high/low for digital. Your motion sensor will return values of "detected" and "undetected".
For this tutorial we're going to read temperature data from a Panasonic EKMC160112. Our unit conversion formula assumes that your temperature sensor is connected to your Arduino's 5V pin for its voltage in, and set up as specified in the sensor's data sheet.
Using the virtual pin board on the Choreo page, select pin 6 to set up your sensor. Select the category 'Motion', then choose the Panasonic EKMC160112.
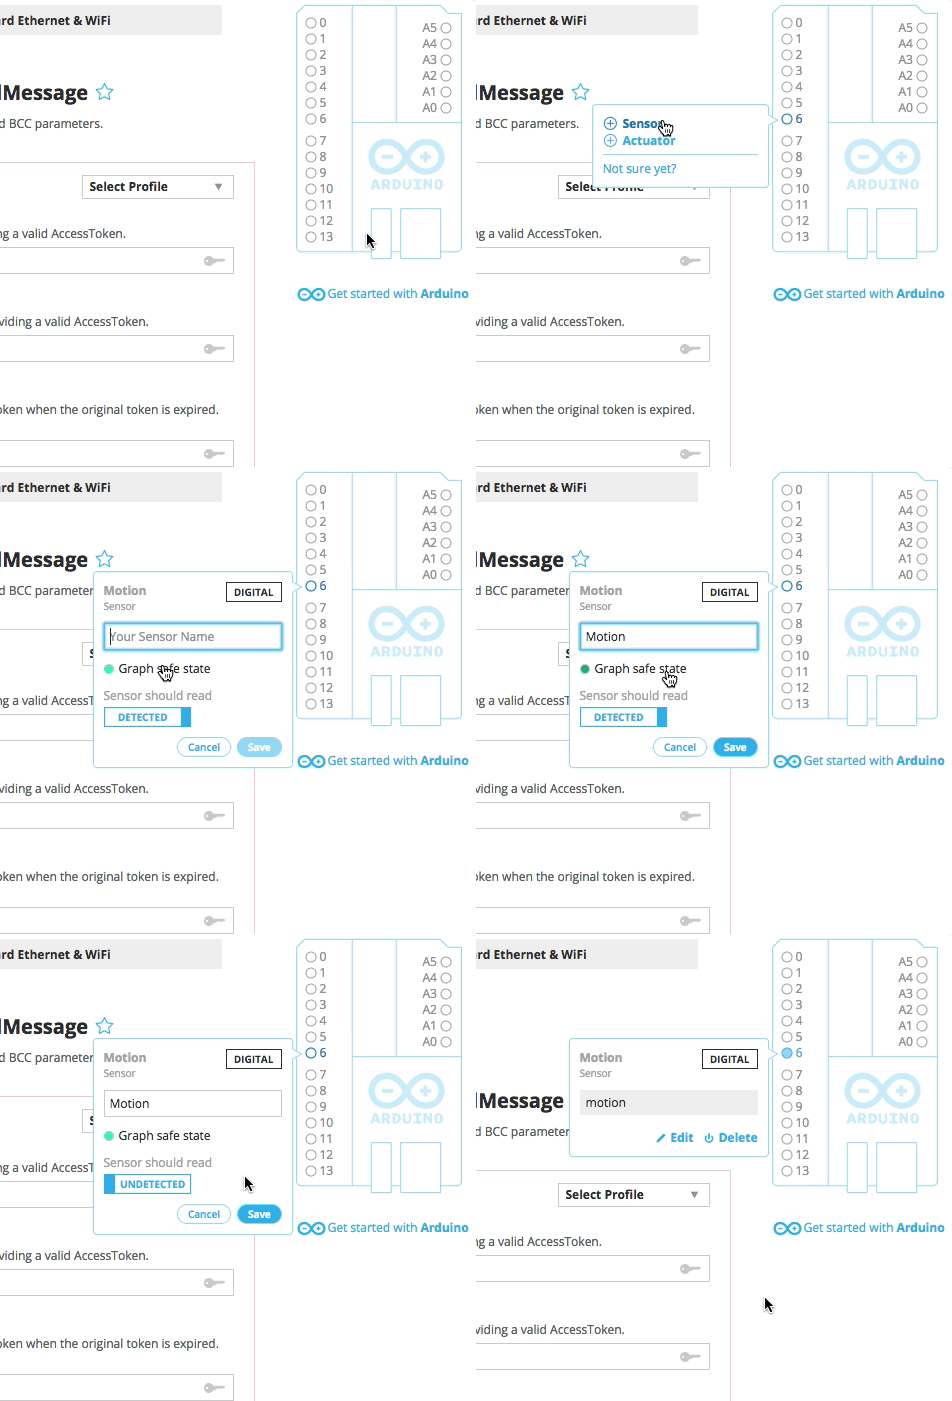
5Each time you set up a digital sensor you'll be asked to specify the safe state. This setting will determine the color coding of the data that appears on your graph. Safe data is colored green, and unsafe data is red.
Set the safe state as undetected. That's all we need to do to set up our sensor, so press Save.
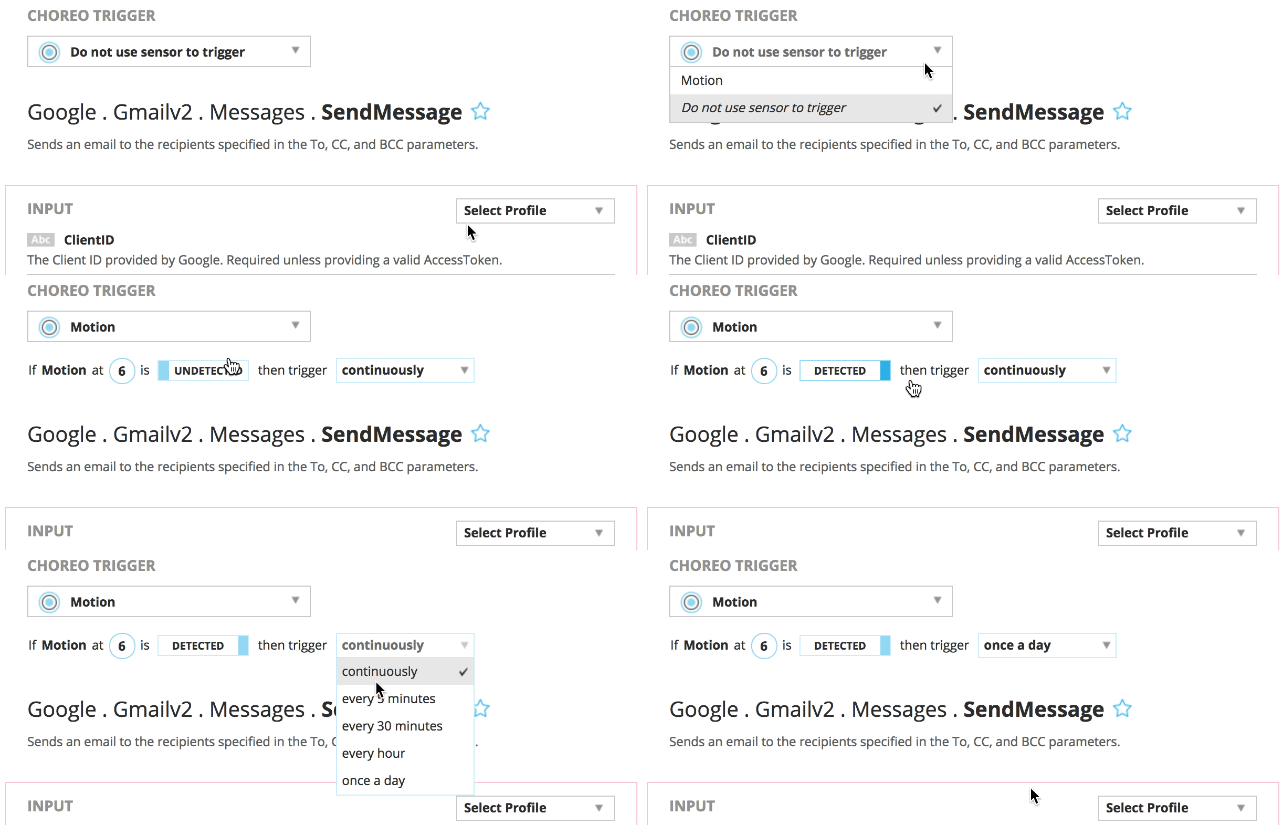
6We will focus on getting sensor data graphs running first. In part 2 of this tutorial, we will set up the email alert. So for now, set a condition based on that sensor in order to run the SendMessage Choreo as infrequently as possible. Use the conditions interface to set a condition that will usually be false, and set the frequency to once a day.
Generate your code
7Next, we'll generate the code that will send our sensor data to Temboo. Scroll down and find the Code section. Click the triangle to open the Code menu and choose Data Viz.
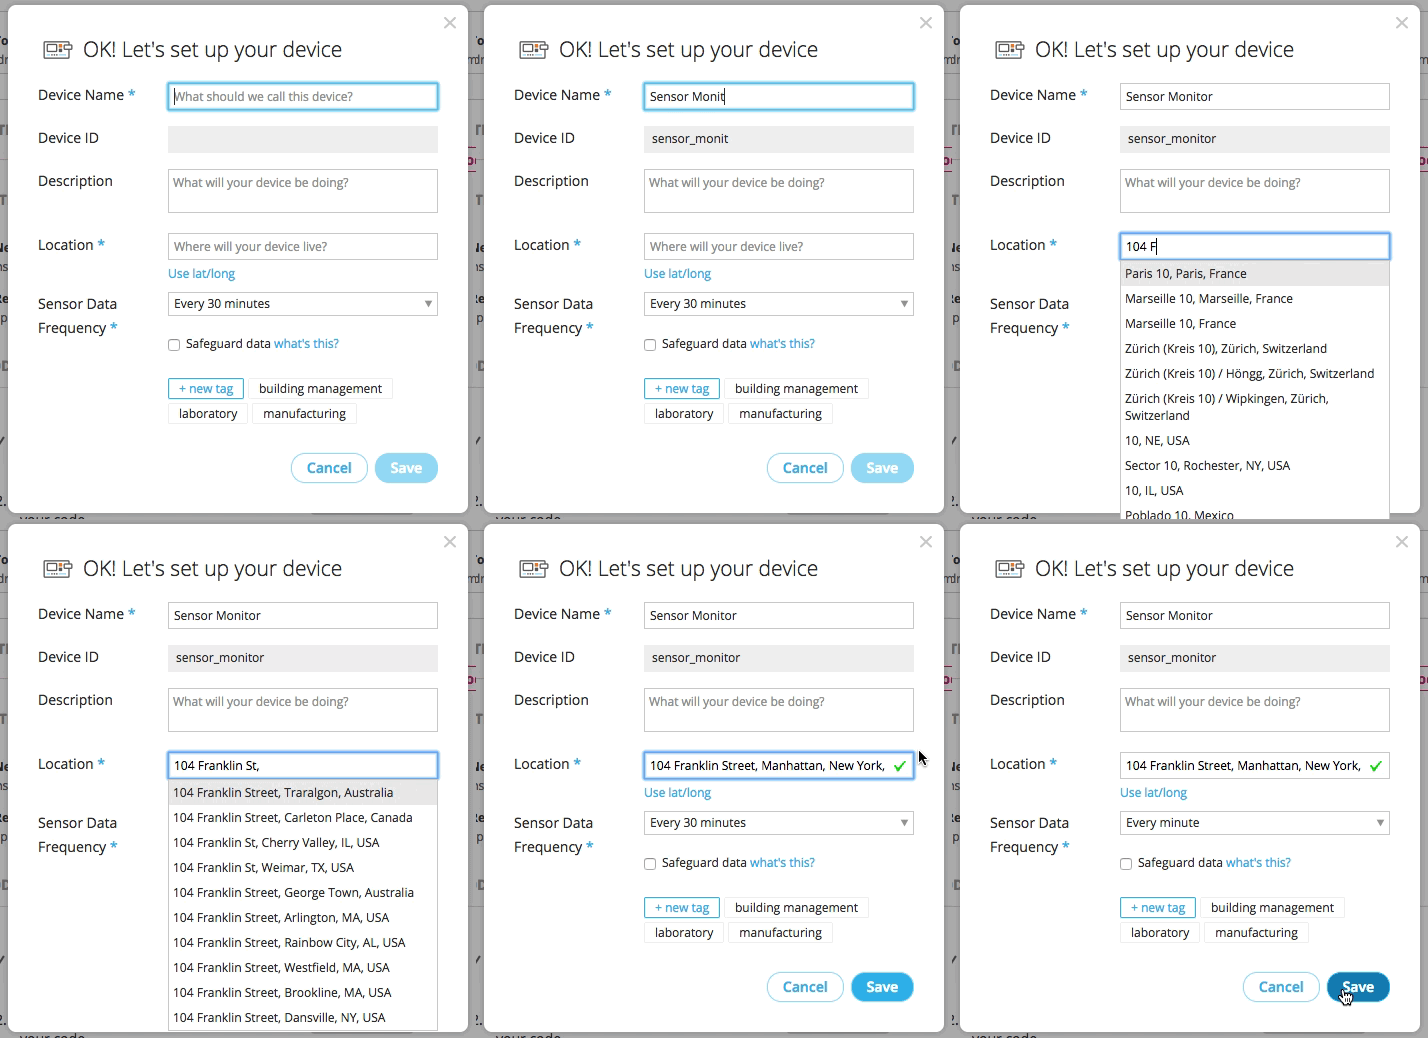
8Now you will register your device. To do so, name your device and, optionally, give it a description. Specify the device location—this will allow you to view your devices on a map. For testing purposes, it's good to set a relatively short sensor interval so that you can see sensor data populate your graphs quickly. You can use the custom interval option for this. Press Save when you're done.
Run your code
9Once you've registered your device, you'll find the auto-generated Data Visualization code in the Code section. Copy and paste your generated code into the Arduino IDE.
10 Just below the Code section, you'll find the Header File section.
The code in this section contains your Temboo account information and must be included alongside your sketch. To do so, make a new tab in the Arduino IDE, call it TembooAccount.h, and copy this code into it.
11 That's all the code you need. Upload it to your Arduino Yún from the IDE.
View your sensor data graph
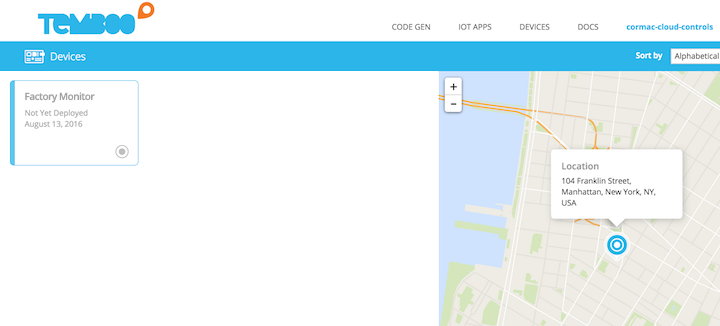
12Now that your Data Visualization sketch is running on your Yún, keep this Choreo page open, and save it for later to use with part two of this tutorial. Open a new browser window to head over to your Devices page to see it in action. A virtual representation of your device will be waiting for you.
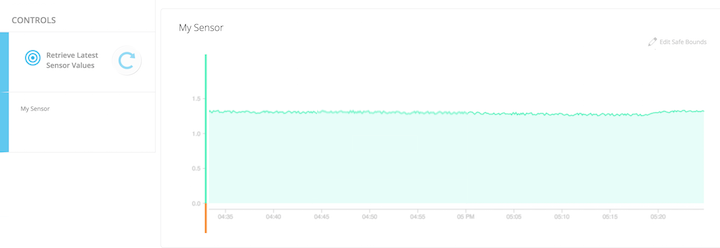
13Select your new device and you'll see a sensor data graph for the sensor that you set up. Over time, you'll be able to see sensor data graphs for various time periods. Additionally, at any time, you can request the latest value of your sensors. This is a handy feature for when you're between sensor intervals but want to know what's happening on your device.
That's it! You now know how to monitor sensor data with Temboo. Follow along with part two of this tutorial to add email alerts triggered by sensor values to your new application.
Need help?
We're always happy to help. Just email us at support@temboo.com, and we'll answer your questions.


